


Business intelligence
Know which location needs you before you make the first call
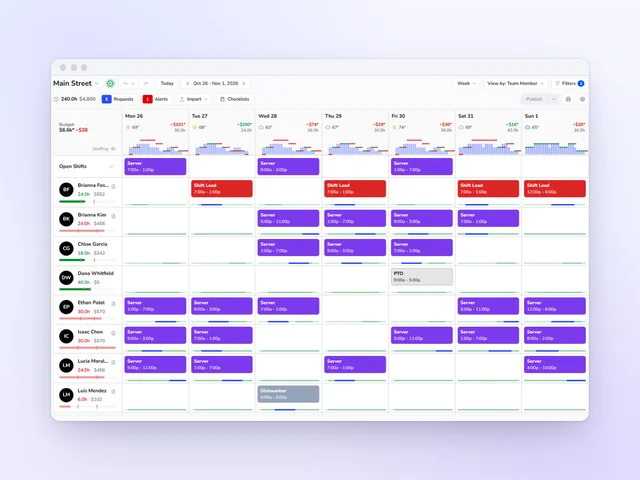
See who's clocked in, who's late and where labor is running ahead of sales at every location, on one screen. When a location's labor percent leaves your range, you get an alert.
- Built for restaurants, coffee shops and bakeries
- Works with Square, Toast and Clover
No credit card requiredFree for up to 10 people
Fix it while the shift is on
Who's in, who's late and how sales are tracking, at every location.
Plan from what really happened
Each day against the forecast, last week and last year.
Weigh sales against labor
POS sales beside labor cost and hours from your time cards.
Bring it all together
Schedule, approvals, sales and the local weather in one view.
What needs you
The day's exceptions, first
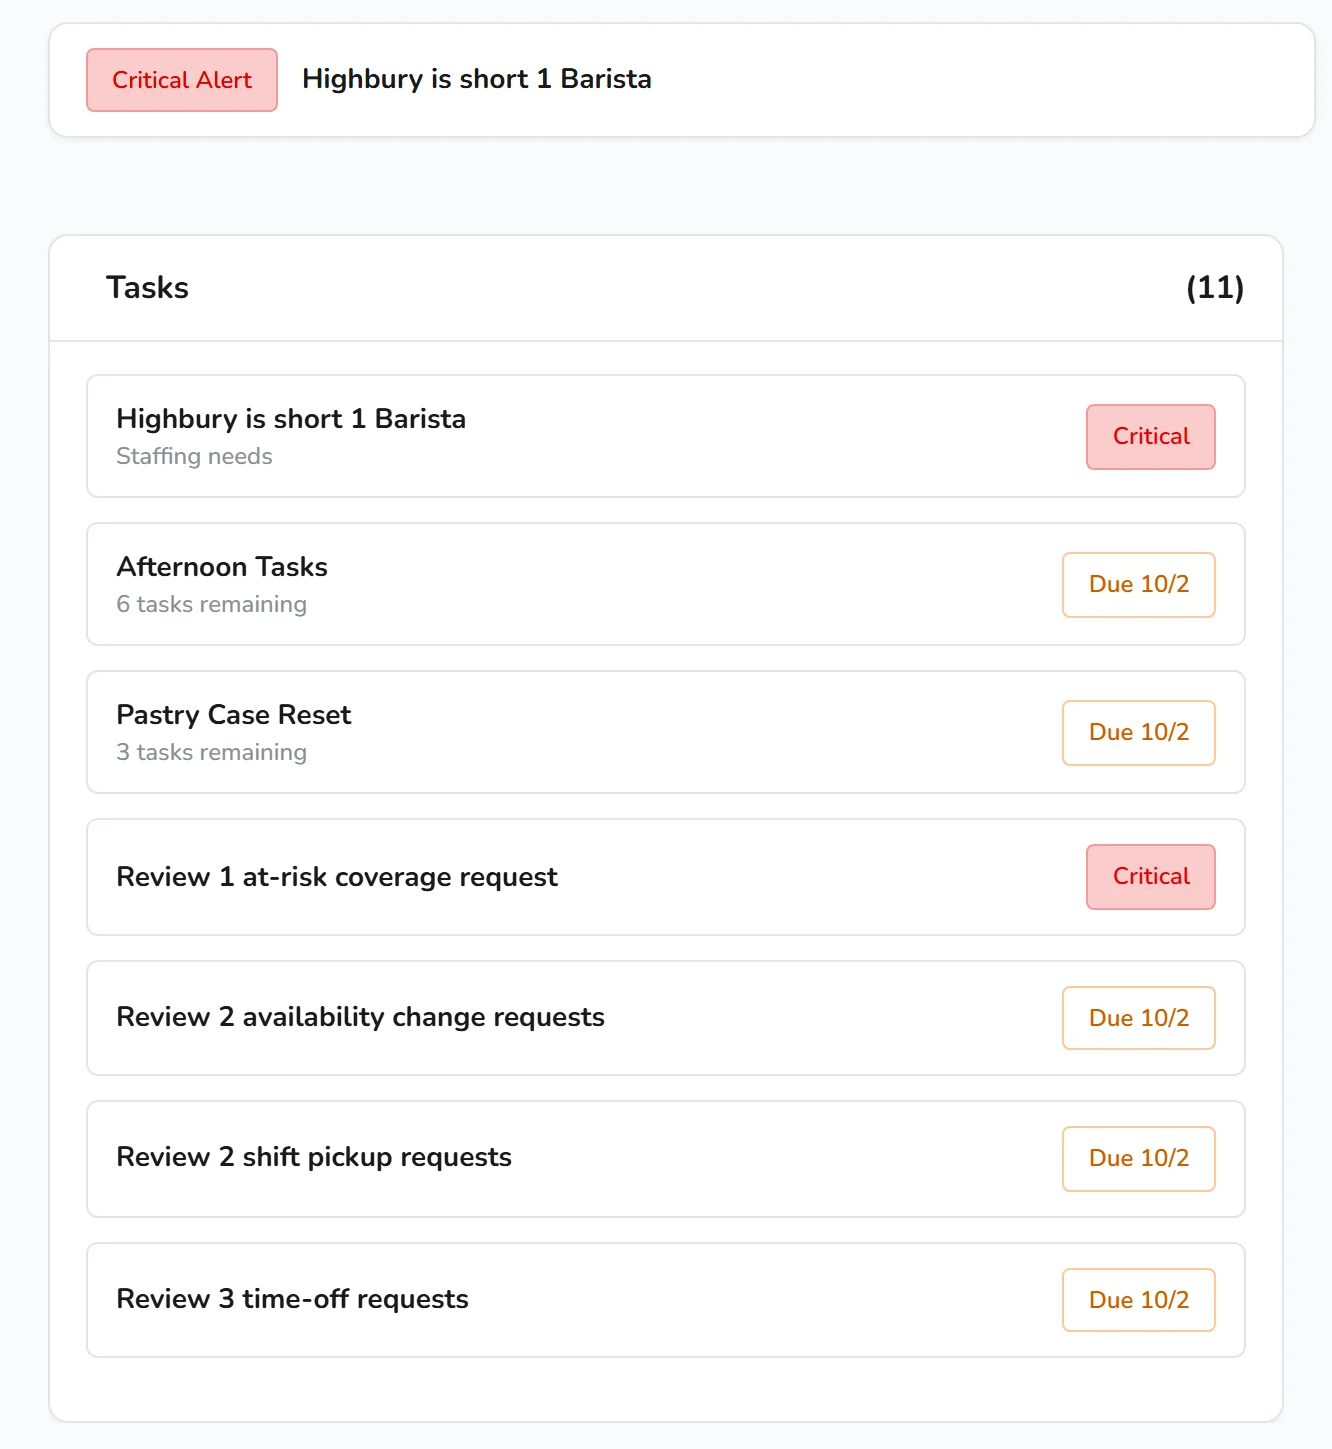
Most of the day runs itself. The dashboard opens on what doesn't: the critical alert, the shift nobody's covered, the request waiting on you.
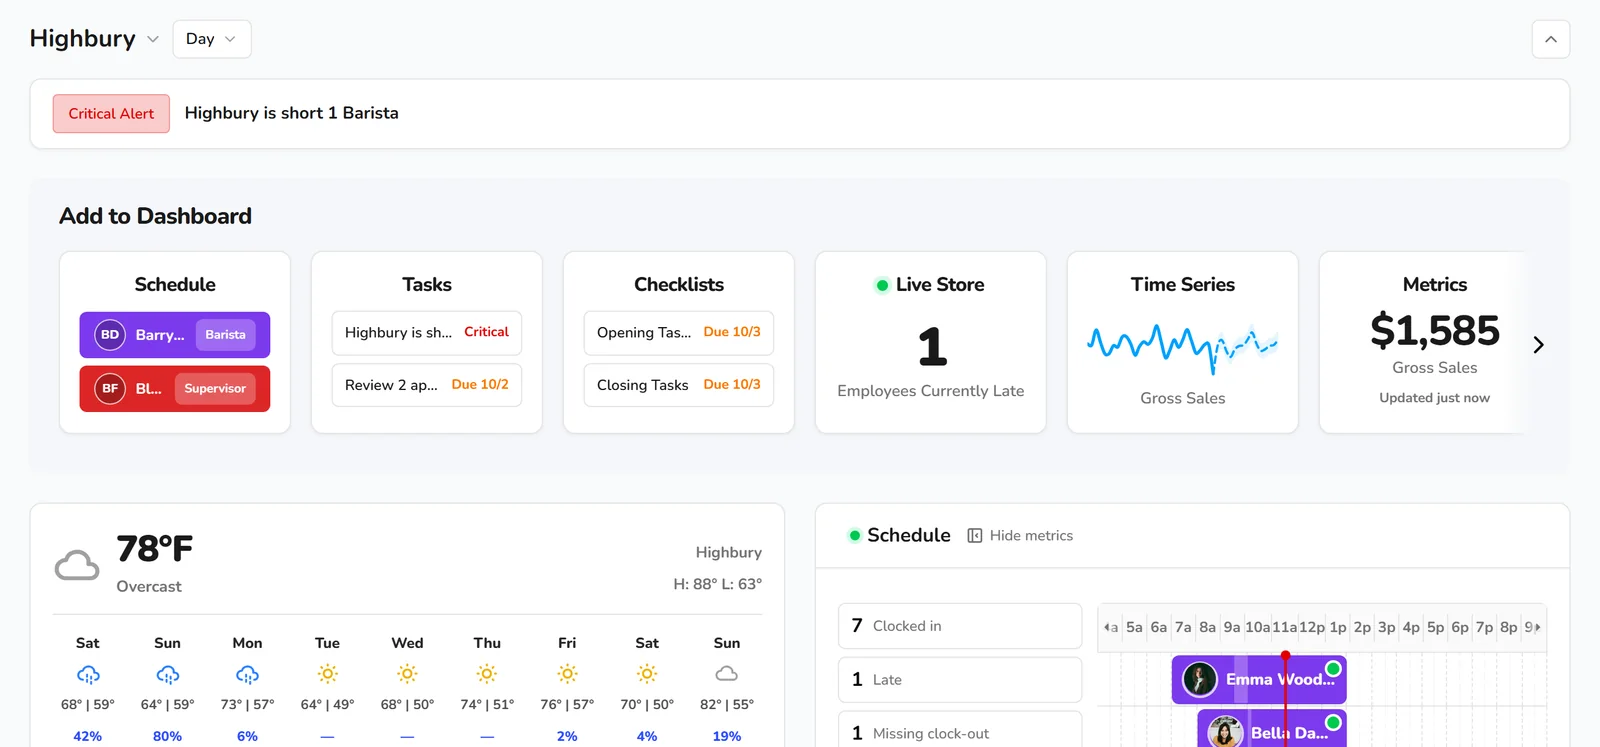
Critical alerts run in a banner above every widget. The Tasks card gathers the rest: today's checklists, time off, shift pickups and drops, availability changes, task photos to review, and coverage requests still open for shifts in the next 48 hours. Approve or deny a request right from the card. Coverage requests open their own page.
- At-risk coverage requests flagged Critical
At a glance
Everything that needs you today, on one screen
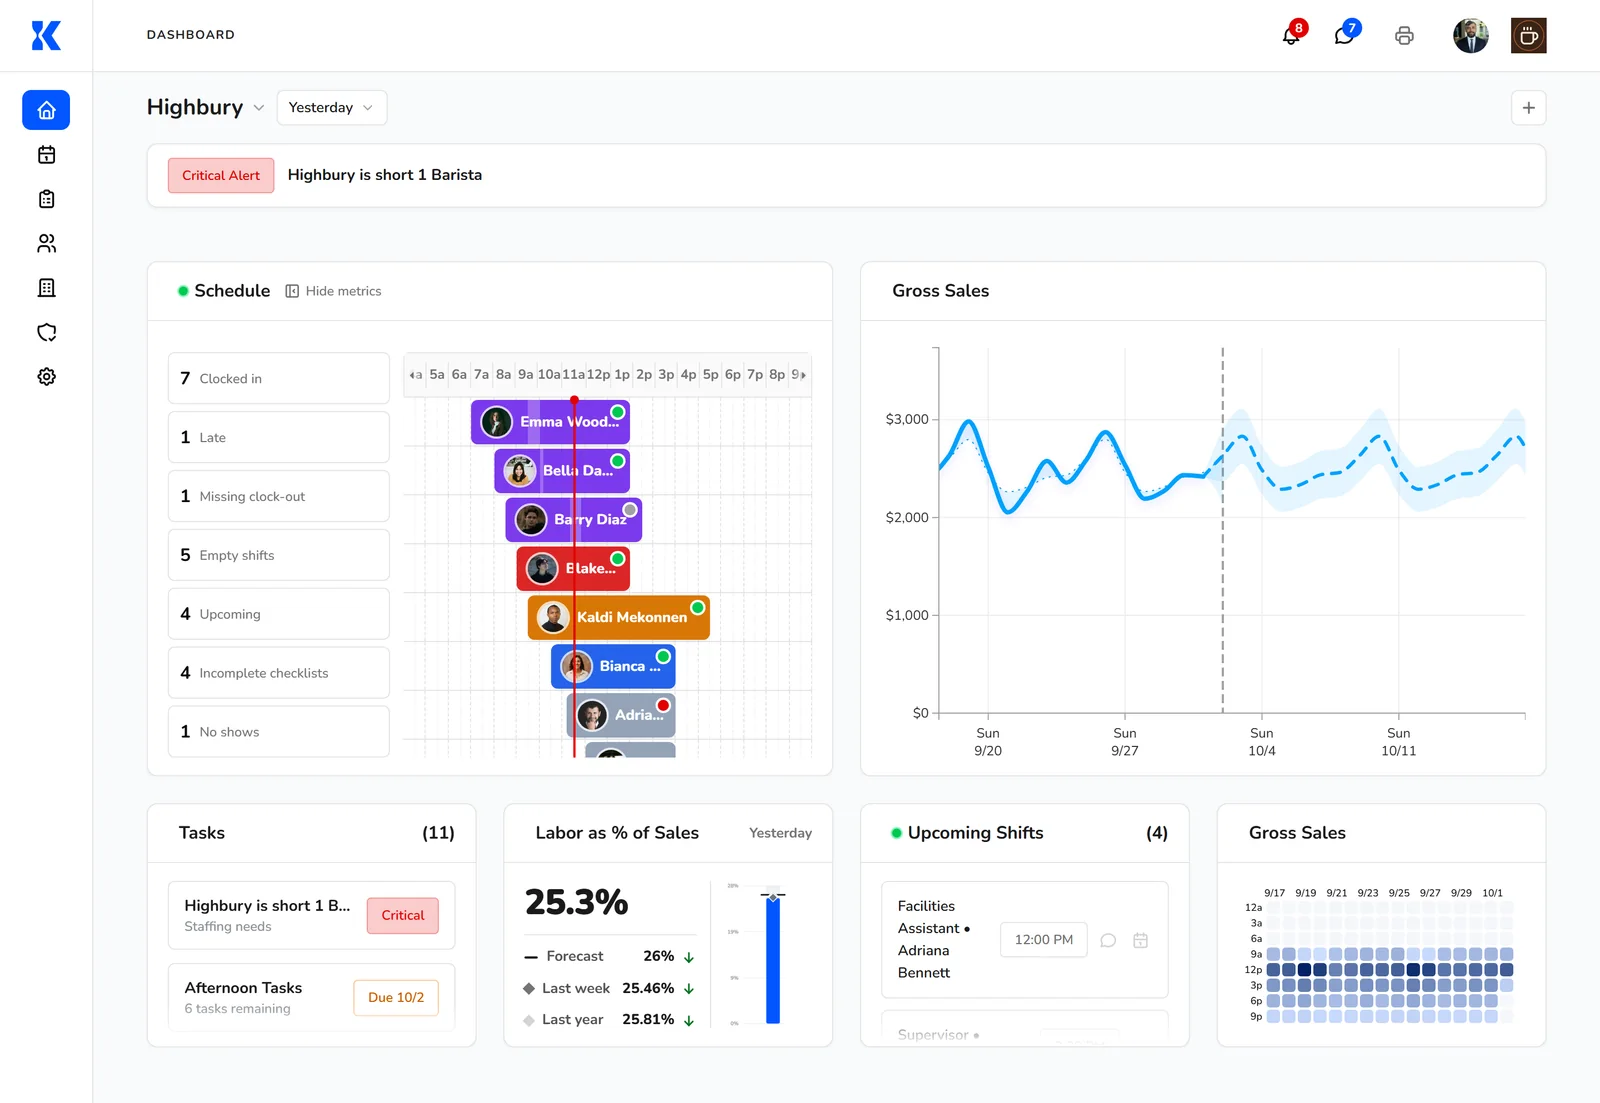
Build the dashboard from a library of widgets, then switch between one location, a district or every location you manage. On Day, Month to date or Year to date, the numbers refresh every 30 seconds. The screen left open in the back office stays current.
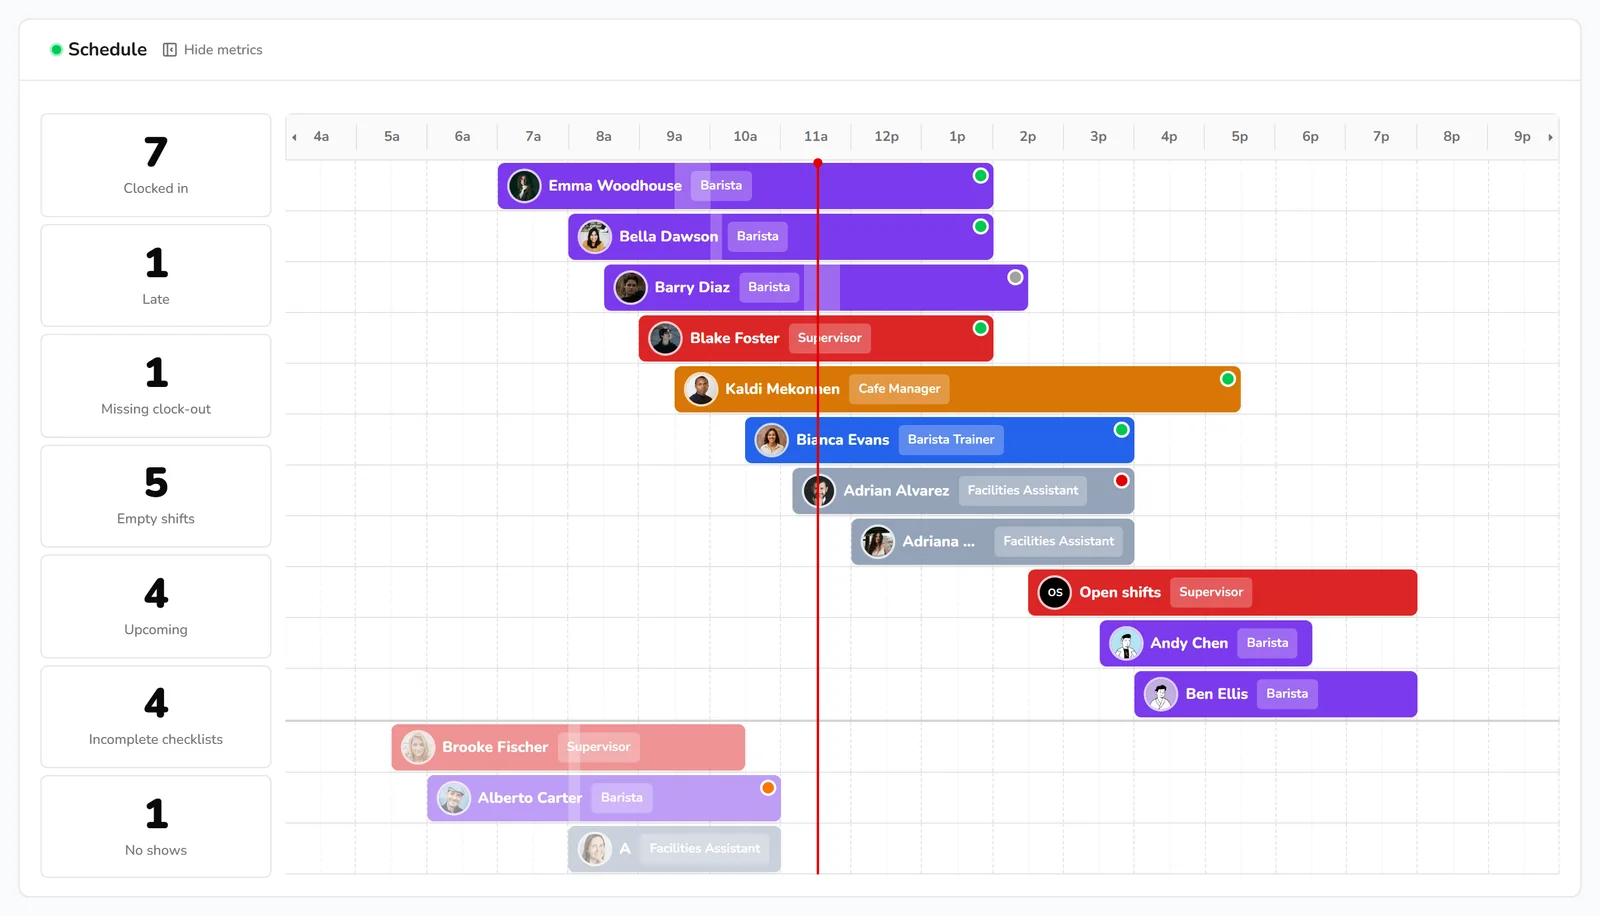
- Live counts: clocked in, late, missing clock-outs, empty shifts, no-shows
- Sales, labor cost, labor % and sales per labor hour against forecast, last week and last year
Live floor status
Who's late, and by how much
The Schedule widget lays today's shifts on a timeline framed by the location's hours, with a dot for clocked in, on break, late or missing a clock-out. Turn on Show metrics and the live counts sit beside it. Click a count to see just those people, each with how late they are or how far past their shift, and message them from the row.
Sales vs. labor
See labor running ahead of sales while you can still send someone home
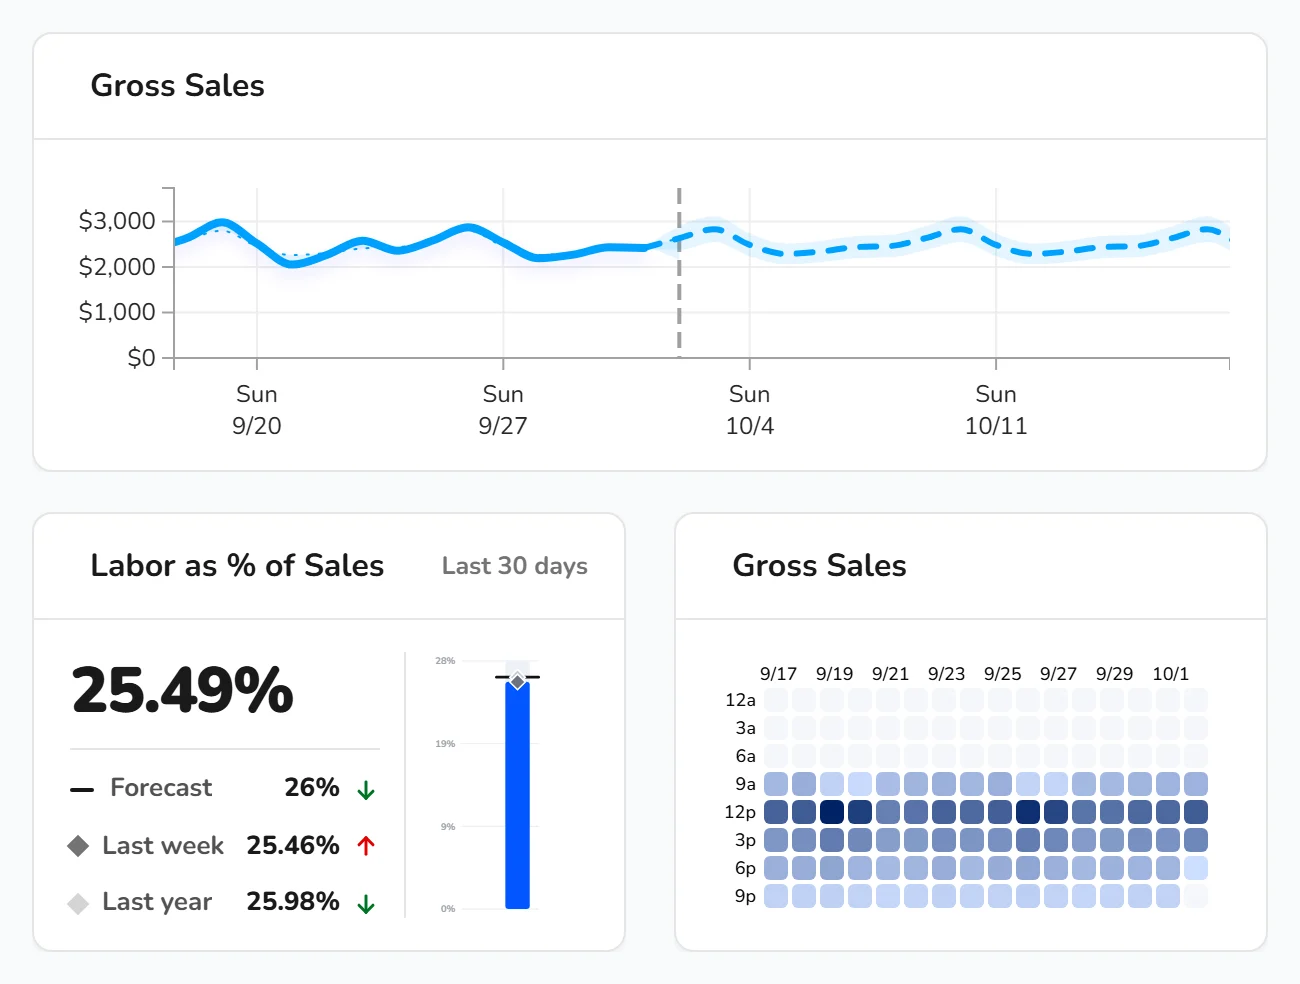
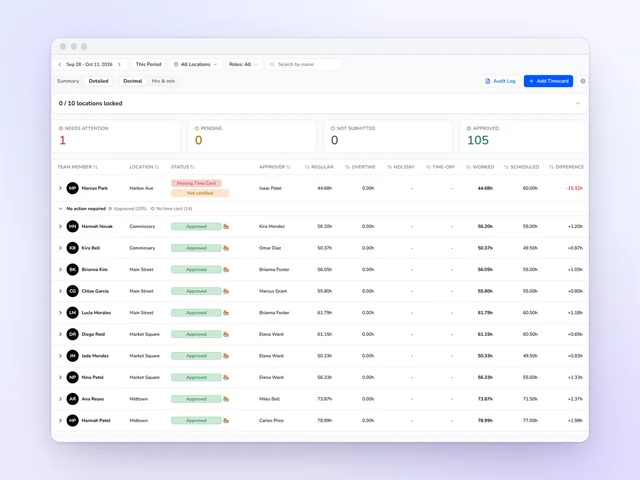
Kronto puts your POS sales beside the labor hours and cost from its own time cards. Metric cards cover gross sales, transactions, average transaction, tips, tips as a percent of sales, labor hours, labor cost, labor as a percent of sales and sales per labor hour. Each one compares against Kronto's forecast, the same period last week and last year.
The Time Series chart plots actuals against the forecast and its confidence band. The Heat Map shows which days and hours run busiest.
- Forecast Health: whether each metric is inside its forecast range
- Day, Yesterday, Month to date, Year to date, Last 30 and Last 90 days
Multi-location
One cafe, one district, or every location
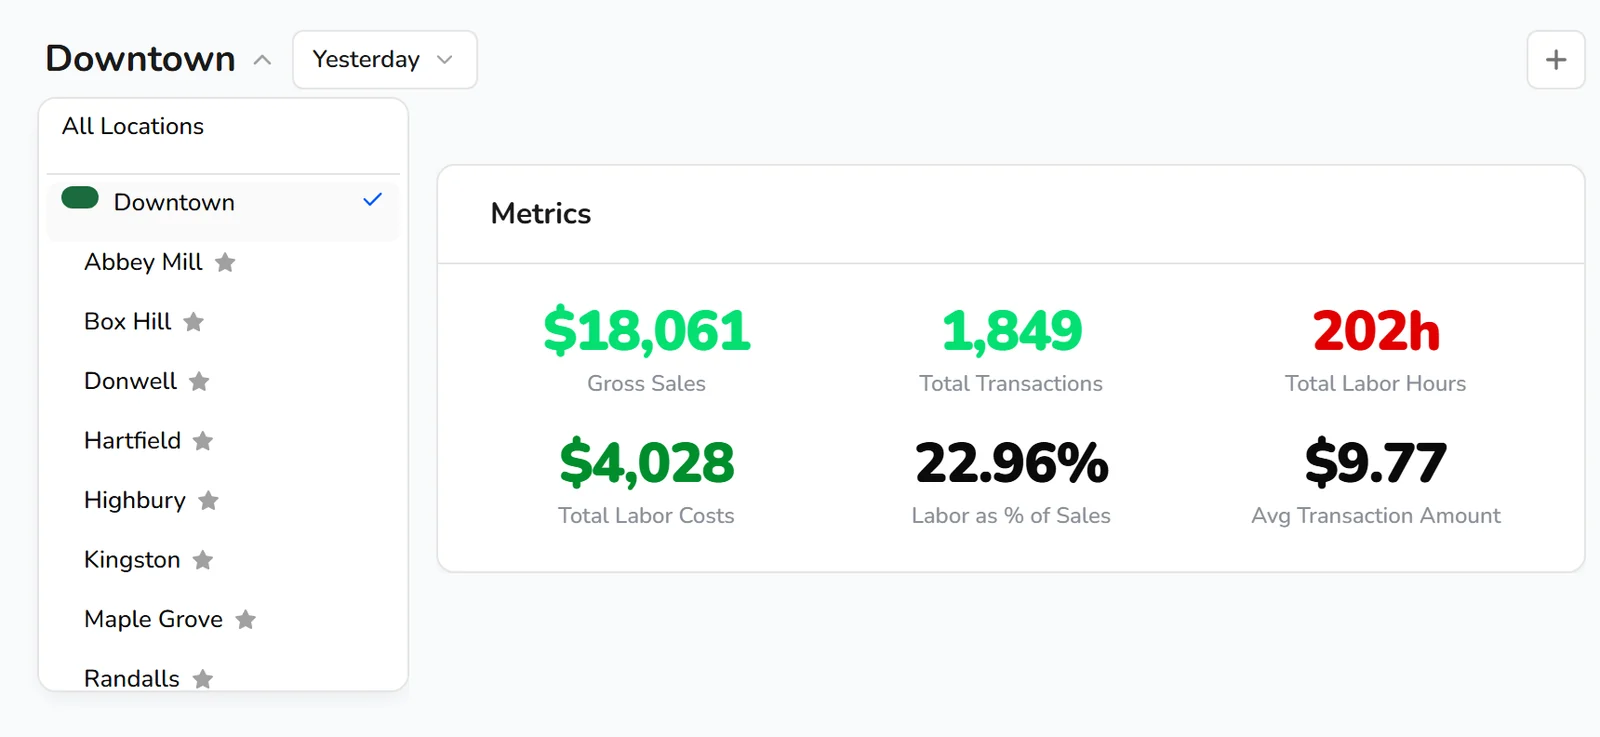
Pick one location, a district or all of them from the picker at the top. The metric cards roll up across everything in scope, and the comparisons on totals are summed from each location's own numbers. Managers see only the locations they can access.
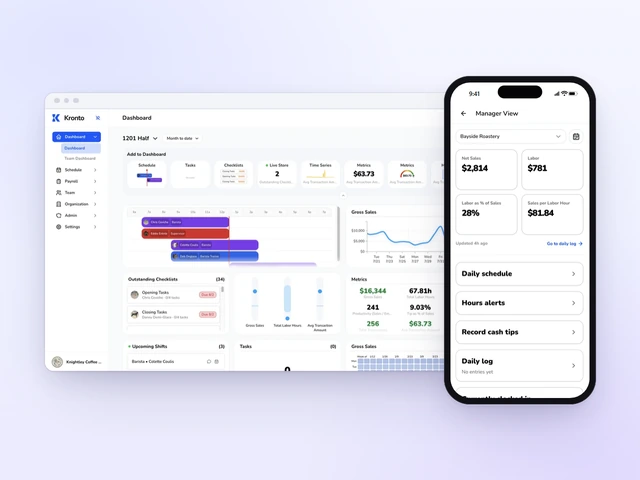
Away from the desk, the Manager view in the Kronto app shows sales, labor, labor percent and sales per labor hour, plus who's clocked in, running late or missing a clock-out.
- Daily stats for Today, Yesterday, Week to date or Last 30 days
Customizable widgets
Build the dashboard you'll actually use
Every manager's dashboard is their own. Drag in Schedule, Tasks, Checklists, Live Store, Time Series, Metrics, Heat Map, Forecast Health or Weather, then reorder and resize. Flip a widget over to change its settings, like which metric a chart plots or whether the weather shows by day or by hour. Kronto saves the layout to your account as you go.
- The location's weather forecast, with chance of rain
Frequently asked questions
How often does the Kronto dashboard update?
When you view Day, Month to date or Year to date, the dashboard refreshes its numbers every 30 seconds. Live clock-in counts and today's sales stay current without reloading the page.
Where do the sales and labor numbers come from?
Sales and transactions come from your connected point of sale. Labor hours and labor cost come from Kronto's own time cards. Labor as a percent of sales and sales per labor hour need no spreadsheet.
Can I see all of my locations at once?
Yes. The location picker switches between one location, a district, or all locations. In a district or all-locations view, the metric cards roll up across every location you have access to.
Can each manager set up their own dashboard?
Yes. Each person builds their own layout from the widget library, resizes and reorders widgets, and Kronto saves the layout to their account.
Start the day on the location that needs you
We'll show you who's clocked in, who's late and where labor is running ahead of sales, at every location you run.
Get started
No credit card requiredFree for up to 10 people